Streaks and progress
Your focus history
History charts your focused time by day, week, month and year, splits it by tag, and lists every session. It is part of Catch the Ghost Pro.
- Available on iPhone and Android
- Pro
History is where you read back what your focus has added up to. It shows four totals for any day, week, month or year, charts the time by tag, and lists the sessions behind the numbers. History is part of Catch the Ghost Pro on iPhone and Android; without Pro, the History screen shows an upgrade prompt instead.
How do I open History and read the Day view?
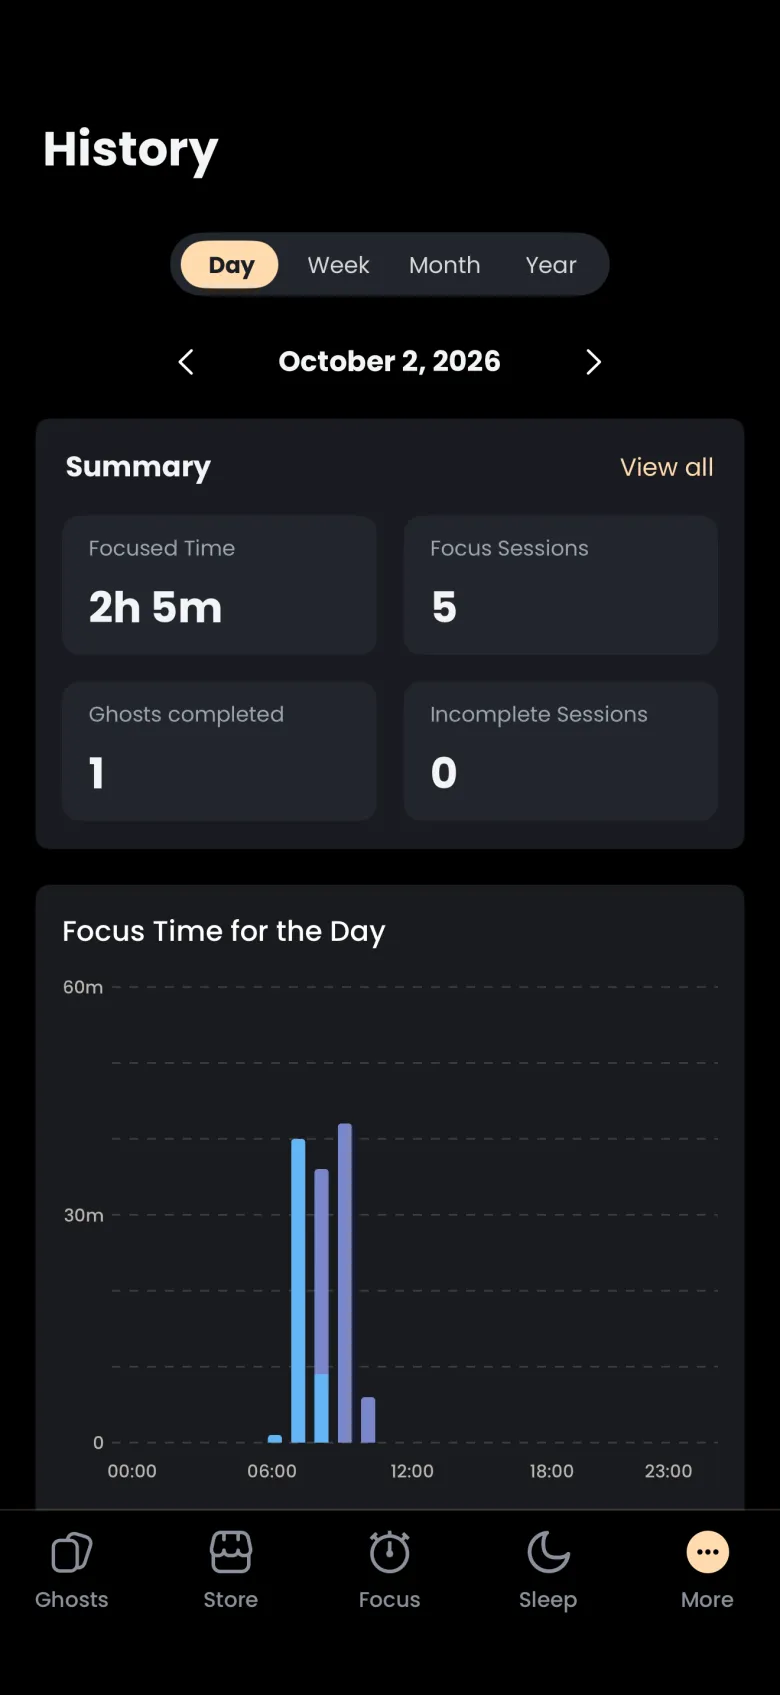
Open the More menu and tap History. It opens on Today, with a Summary card at the top and a chart of the day below it. Use the arrows beside the date to step to another day.
- Tap More at the right end of the tab bar, then tap History.
- Tap the left arrow beside the date to go to the previous day.
- Read the Summary card, then the Focus Time for the Day chart. Bars are hourly and colored by tag.
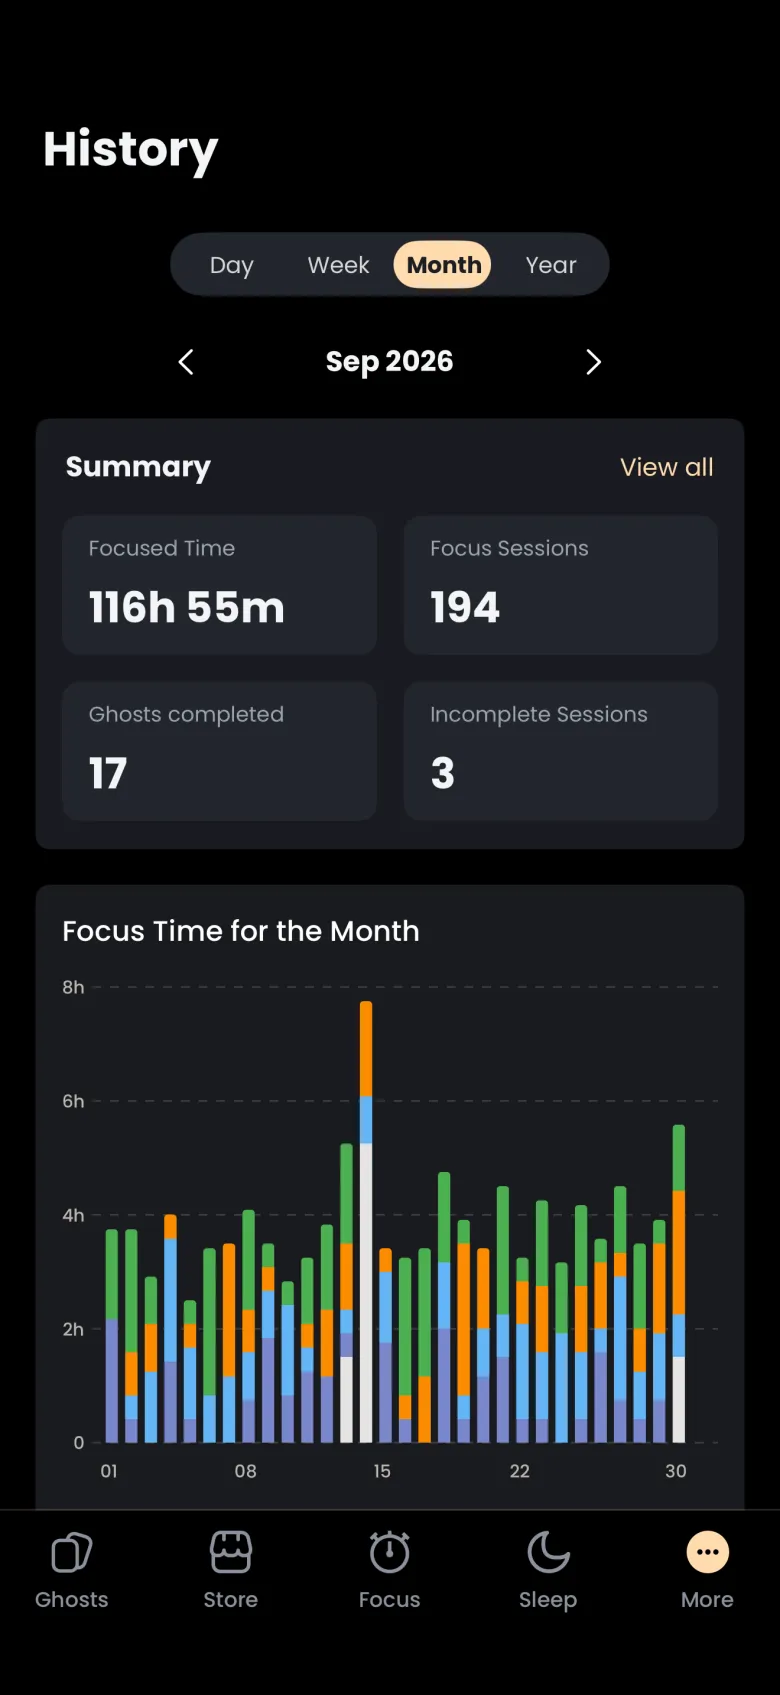
The Summary card holds four tiles. Focused Time is the total time in the period and Focus Sessions is how many sessions made it. Ghosts completed counts sessions that finished a ghost, so it is not the same as the number of apparitions you revealed: a day of five Deep Focus sessions can read 1. Incomplete Sessions counts sessions you stopped before the timer ended. In Deep Focus, that is a lost apparition.
Where can I see a list of my sessions?
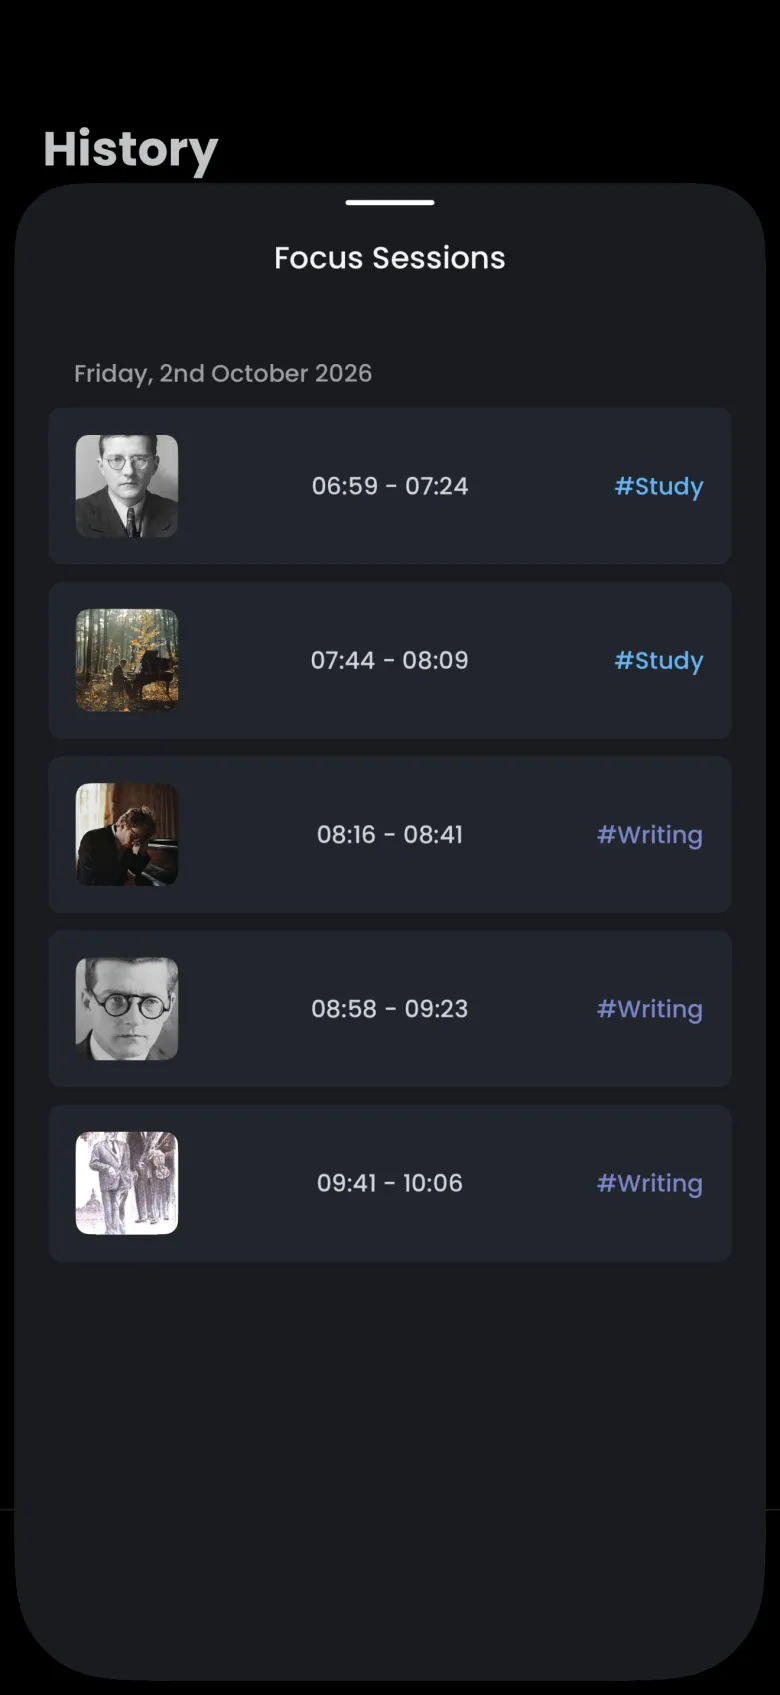
The Summary card has a View all link that opens a list of every session in the period. Each row shows the apparition the session revealed, the time it ran and the tag you gave it. Use it to check what you were doing at a given time.
- On the Summary card, tap View all. A Focus Sessions sheet opens, grouped by date.
- Read down the rows: a thumbnail, a start and end time, and a tag such as Study or Writing.
- Drag the sheet down by its handle to go back to History.
A Shallow Focus session shows a swimmer icon in place of a thumbnail, because Shallow Focus catches nothing. The rows are for reading only; tapping one does nothing. A session is listed under the day it started.
How do I switch between day, week, month and year?
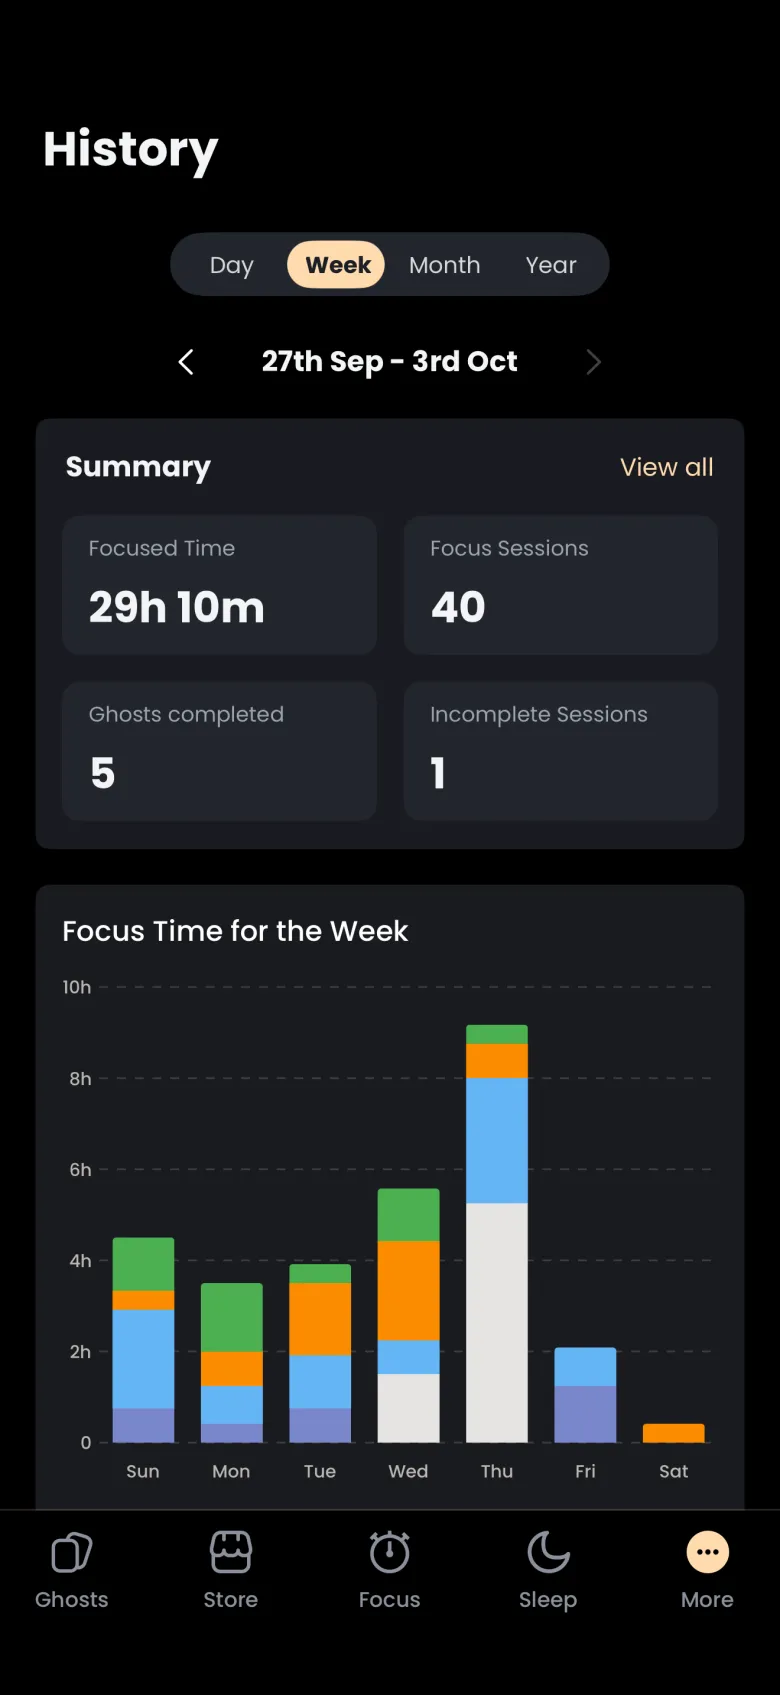
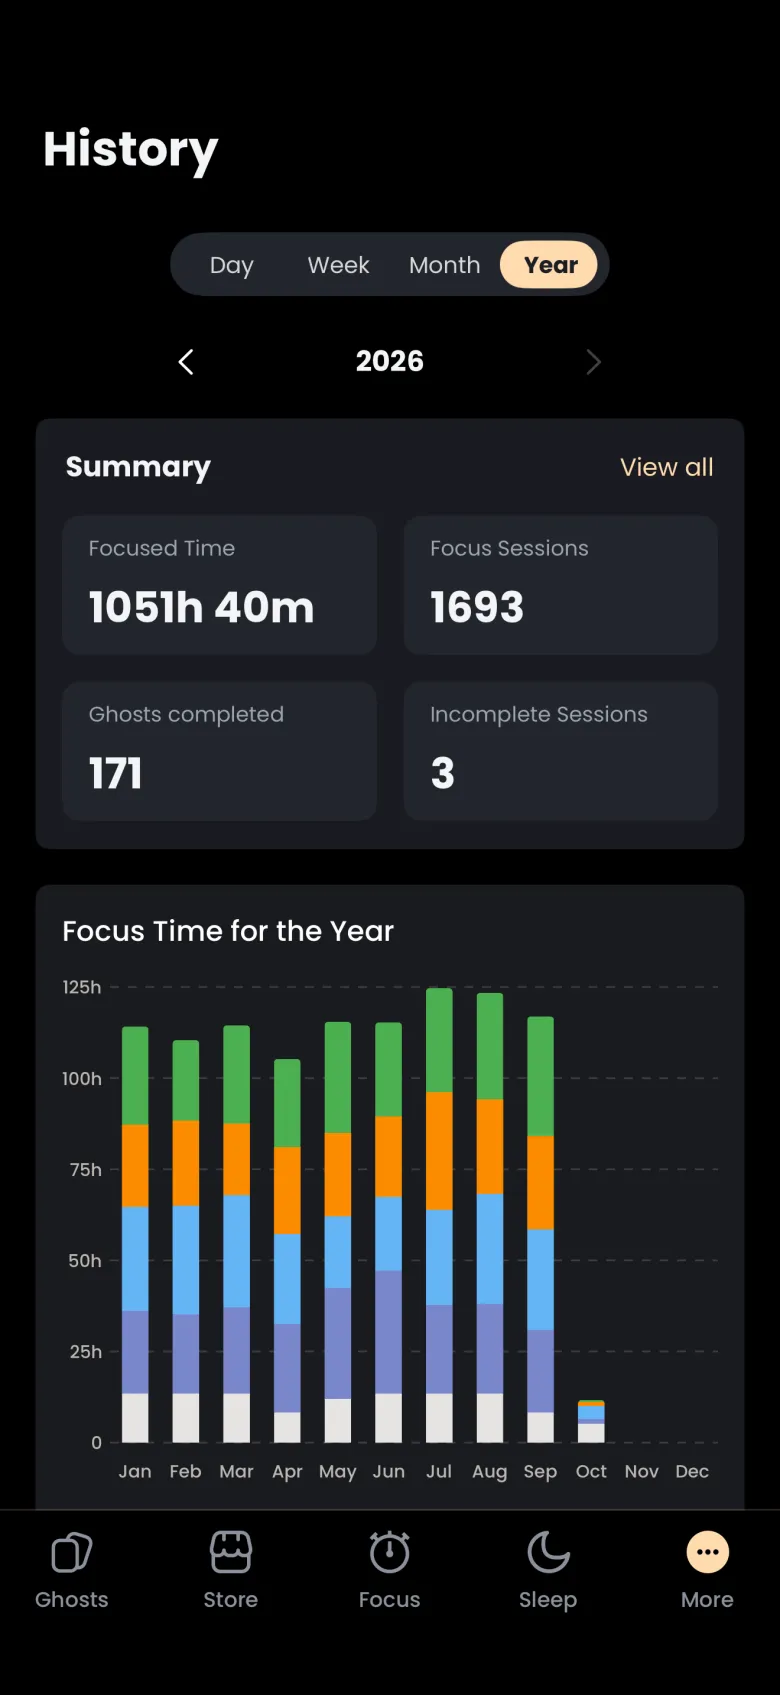
Use the switcher at the top of History: Day, Week, Month and Year. Each view keeps the same four tiles and draws a chart that suits its length. The date arrows step through earlier periods, and the arrow on the right turns grey when you reach the current one.
- Tap Week in the switcher. The range runs Sunday to Saturday, for example 27th Sep to 3rd Oct.
- Tap Month for a bar for every day of the month, then use the left arrow to step to a full month.
- Tap Year for one stacked bar per month.
How do I see which tags took my time?
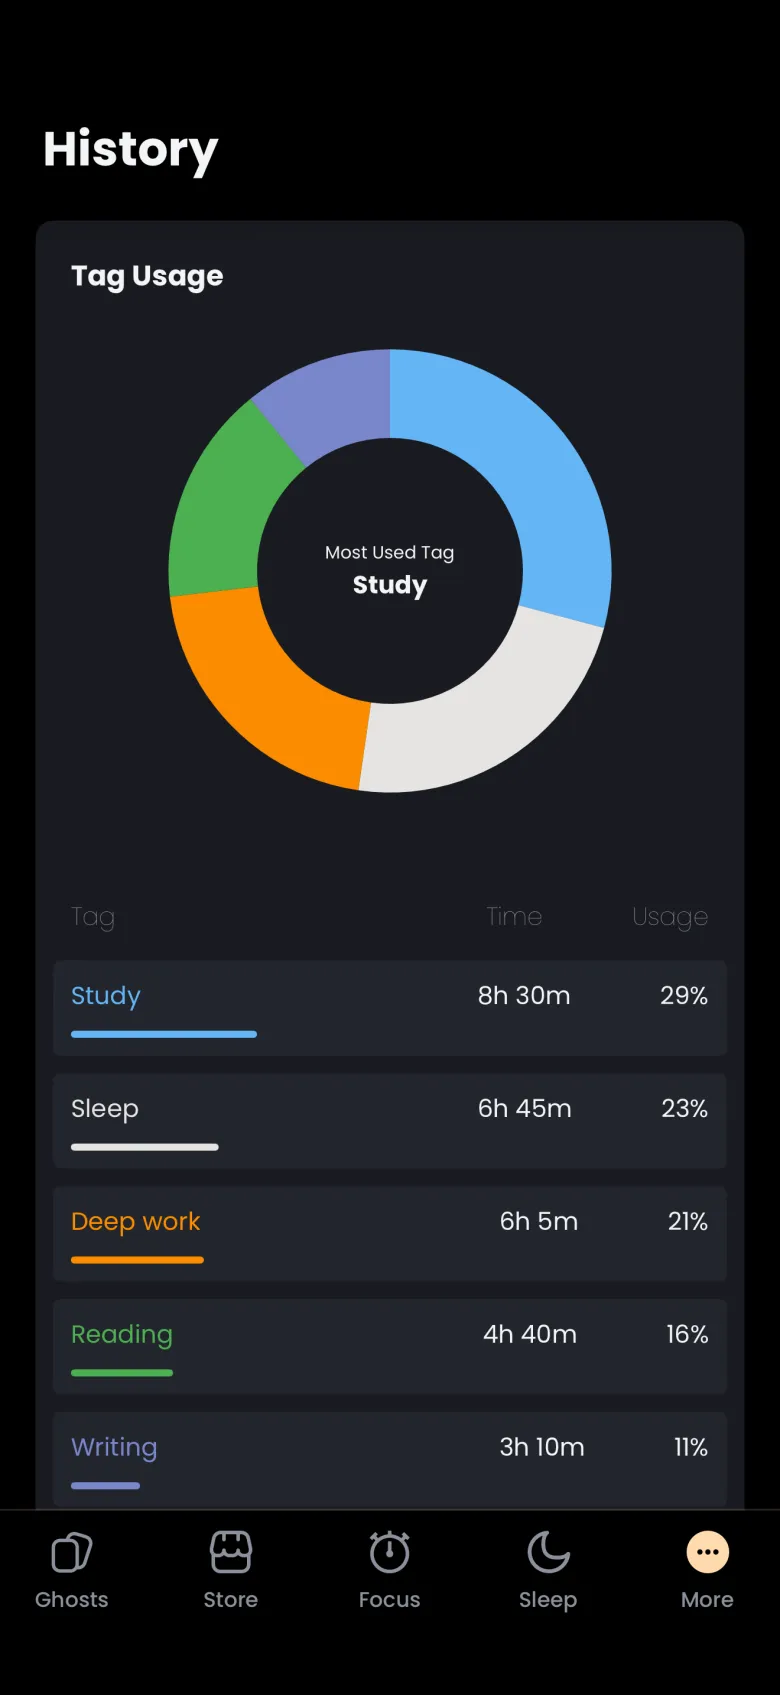
Scroll down on the Week, Month or Year view to the Tag Usage card. A donut chart names your most used tag, and a table lists each tag with its time and share of the period. Tap a tag in the table to see how it was used day by day.
- Scroll down to the Tag Usage card.
- Read the donut and the table. Each row shows a tag, its total time and its percentage.
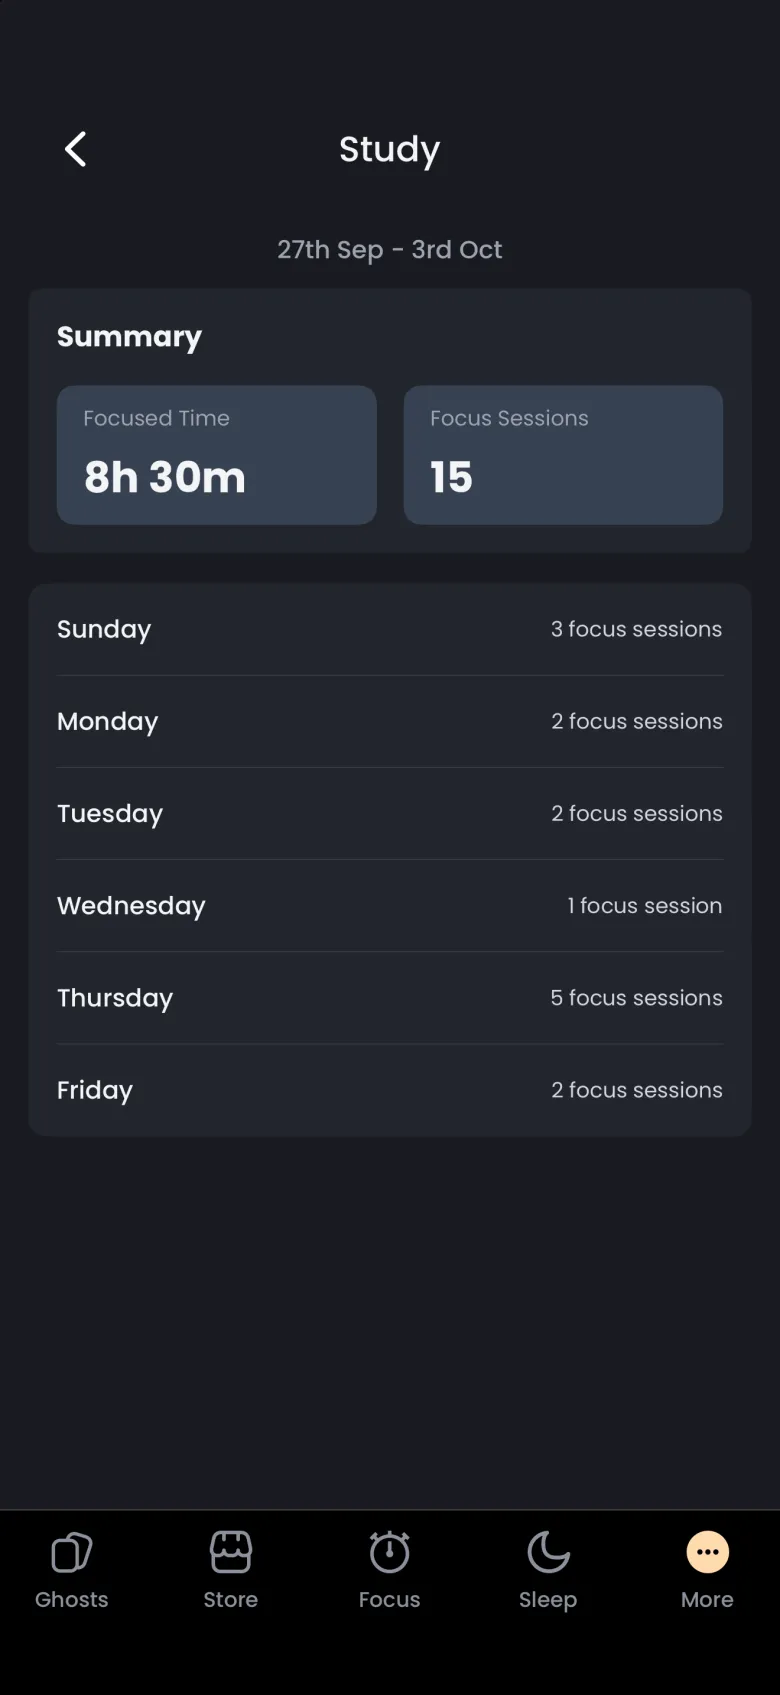
- Tap a tag, for example Study. A detail screen shows that tag’s focused time, its session count and the sessions on each day.
- Tap the back arrow at the top left to return to History.
Tags are the labels you attach to sessions. See Tags to create, rename or recolor them.
Does sleep count in my focused time?
Yes. Sleep Timer sessions count toward Focused Time, Focus Sessions and Tag Usage, and Sleep appears as its own tag in the chart and the table. On a night that spans midnight, the charts clip the session to each period, so each day shows only the hours that fell inside it. Reading the Week view above, Sleep is the white segment in each bar.
If you would rather see only the time you spent awake and focused, read the tag rows for your other tags. For how the Sleep Timer works, see Sleep Timer.